
紅白歌合戦の未来の視聴率をPythonで予測
日本の年末の風物詩、「紅白歌合戦」の視聴率が毎年話題になります。
Pythonを利用して、紅白歌合戦の未来の視聴率を予想してみましょう。
2000年から2023年までの紅白歌合戦の視聴率一覧
まず、過去2000年から2023年までの紅白歌合戦の視聴率を一覧にしてみます。
第51回 (2000年): | 前半: 39.2% | 後半: 48.4%
第52回 (2001年): | 前半: 38.1% | 後半: 48.5%
第53回 (2002年): | 前半: 37.1% | 後半: 47.3%
第54回 (2003年): | 前半: 35.5% | 後半: 45.9%
第55回 (2004年): | 前半: 30.8% | 後半: 39.3%
第56回 (2005年): | 前半: 35.4% | 後半: 42.9%
第57回 (2006年): | 前半: 30.6% | 後半: 39.8%
第58回 (2007年): | 前半: 32.8% | 後半: 39.5%
第59回 (2008年): | 前半: 35.7% | 後半: 42.1%
第60回 (2009年): | 前半: 37.1% | 後半: 40.8%
第61回 (2010年): | 前半: 35.7% | 後半: 41.7%
第62回 (2011年): | 前半: 35.2% | 後半: 41.6%
第63回 (2012年): | 前半: 33.2% | 後半: 42.5%
第64回 (2013年): | 前半: 36.9% | 後半: 44.5%
第65回 (2014年): | 前半: 35.1% | 後半: 42.2%
第66回 (2015年): | 前半: 34.8% | 後半: 39.2%
第67回 (2016年): | 前半: 35.1% | 後半: 40.2%
第68回 (2017年): | 前半: 35.8% | 後半: 39.4%
第69回 (2018年): | 前半: 37.7% | 後半: 41.5%
第70回 (2019年): | 前半: 34.7% | 後半: 37.3%
第71回 (2020年): | 前半: 34.2% | 後半: 40.3%
第72回 (2021年): | 前半: 31.5% | 後半: 34.3%
第73回 (2022年): | 前半: 31.2% | 後半: 35.3%
第74回 (2023年): | 前半: 29.0% | 後半: 31.9%
(引用元:Wikipediaより)
紅白歌合戦の視聴率をPythonでグラフ化
次に、上記の年ごとの視聴率を、Pythonでグラフ化してみましょう。
import matplotlib.pyplot as plt

# 紅白歌合戦の視聴率データ
years = list(range(2000, 2024))
viewership_first_half = [39.2, 38.1, 37.1, 35.5, 30.8, 35.4, 30.6, 32.8, 35.7, 37.1, 35.7, 35.2, 33.2, 36.9, 35.1, 34.8, 35.1, 35.8, 37.7, 34.7, 34.2, 31.5, 31.2, 29.0]
viewership_second_half = [48.4, 48.5, 47.3, 45.9, 39.3, 42.9, 39.8, 39.5, 42.1, 40.8, 41.7, 41.6, 42.5, 44.5, 42.2, 39.2, 40.2, 39.4, 41.5, 37.3, 40.3, 34.3, 35.3, 31.9]

# グラフの作成
plt.figure(figsize=(15, 8))
plt.plot(years, viewership_first_half, marker='o', label='First Half (1 part)', color='blue')
plt.plot(years, viewership_second_half, marker='o', label='Second half (2 parts)', color='red')
plt.xlabel('Year')
plt.ylabel('Viewing rate (%)')
plt.title('Kohaku Uta Gassen ratings by year (2000 - 2023)')
plt.legend()
plt.grid(True)
plt.xticks(years, rotation=45)
plt.show()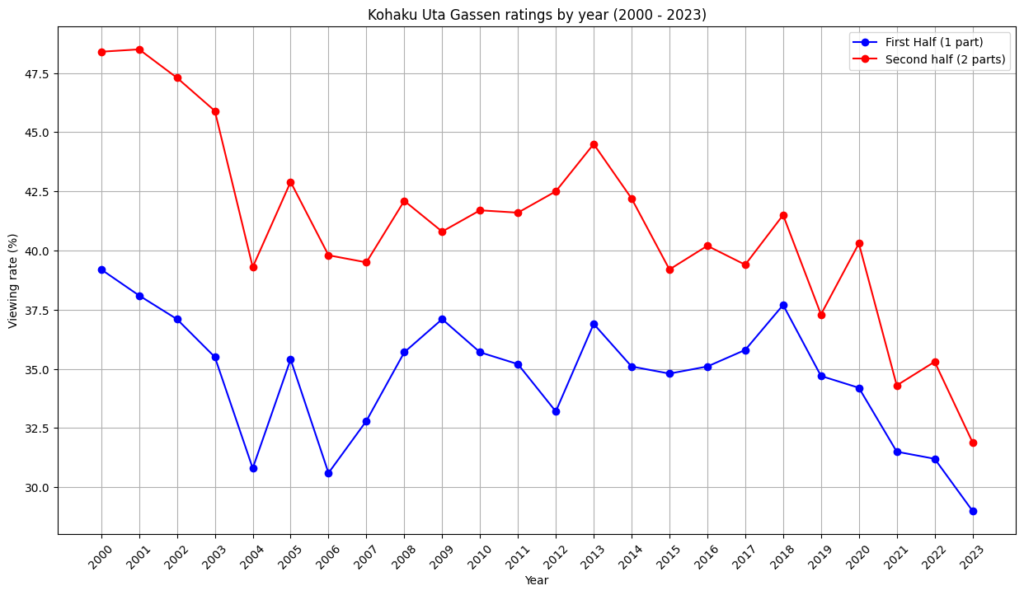
これを見ると、紅白歌合戦の視聴率は、着実に下がっていることが分かりますね。
紅白歌合戦の視聴率が20%以下になる年をPythonで予測
次に、紅白歌合戦の視聴率が20%以下になる年をPythonで予測してみます。
# 2000年と2023年のデータを用いて視聴率が20%になる年を予測した直線を描画
future_years_extended = np.array(range(2000, int(max(predicted_year_first_half, predicted_year_second_half)) + 1)).reshape(-1, 1)
predicted_viewership_first_half_extended = model_first_half_selected.predict(future_years_extended)
predicted_viewership_second_half_extended = model_second_half_selected.predict(future_years_extended)

# グラフに再度プロット
plt.figure(figsize=(15, 8))
plt.plot(years, viewership_first_half, marker='o', label='Actual first half (1 part)', color='blue')
plt.plot(years, viewership_second_half, marker='o', label='Actual second half (2 parts)', color='red')
plt.plot(future_years_extended, predicted_viewership_first_half_extended, label='Predicted first half (Part 1)', color='lightblue', linestyle='dashed')
plt.plot(future_years_extended, predicted_viewership_second_half_extended, label='Predicted Second Half (Part 2)', color='pink', linestyle='dashed')
plt.axhline(y=20, color='green', linestyle='dotted', label='Viewing rate 20%')
plt.xlabel('Year')
plt.ylabel('Viewing rate (%)')
plt.title('Kohaku Uta Gassen ratings by year and predictions of reaching 20%. (2000 - 2043)')
plt.legend()
plt.grid(True)
plt.xticks(np.arange(2000, future_years_extended[-1, 0] + 1, 5), rotation=45)
plt.show()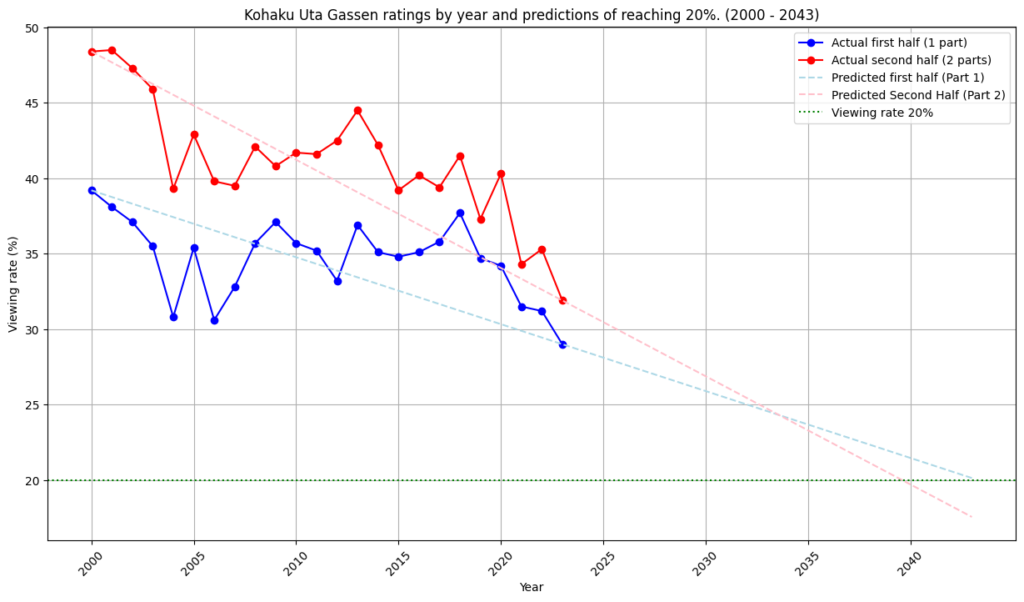
前半(1部)の視聴率が20%になる予測年:2043年
後半(2部)の視聴率が20%になる予測年:2039年
以外と時間がかかりますね。

▼AIを使った副業・起業アイデアを紹介♪

